by J. S. Marron
This page is intended as a "table of contents".
Each analysis has a teaser image to motivate the viewer to look at the
more detailed pages available on the links.
1. A SiZer
Case Book
by P. Chaudhuri, J. S. Marron, J. C. Jiang, C. S. Kim, R. Z. Li, V.
Rondonotti, J. de Uña Alvarez
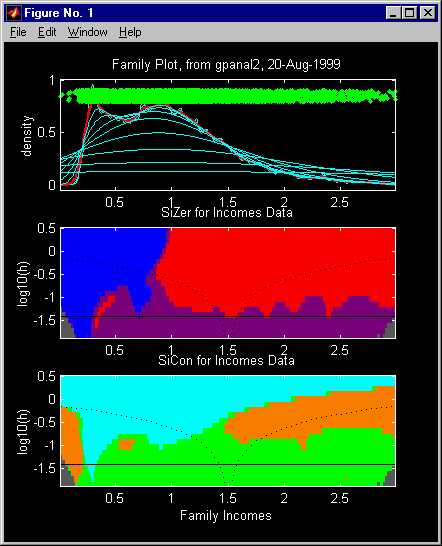
SiZer was developed by Chaudhuri and Marron (1999, JASA, 94, 807-823), to address the problem of "which features in a smooth are important underlying structure, and which are unimportant sampling artifacts?"
Here is one screen shot, using the famous "incomes
data", that establishes the statistical significance of the "two modes".
For a web based introduction to SiZer, more examples showing the practical
efficacy of SiZer, and discussion of other aspects, go here
.
2. CHETA (Curve Height at Event Time Analysis)
by T. Graves, J. S. Marron, A. Mockus and A. Glazner
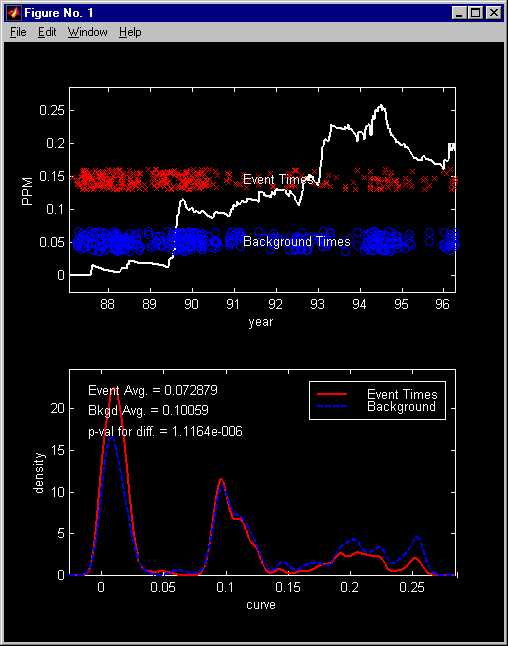
This is a method for assessing statistical significance of connections between a curve and a point process. In particular, do the events of the point process occur more or less often depending on the height of the curve?
Our approach to this is based on evaluating the curve at the event times, and then comparing the resulting population with an appropriate "background" population.
Here is an interesting example from software engineering.
This provides strong evidence (p-value ~ 0.000001) that there is a connection
between rate of faults and perfective maintenance, in a large software
system.
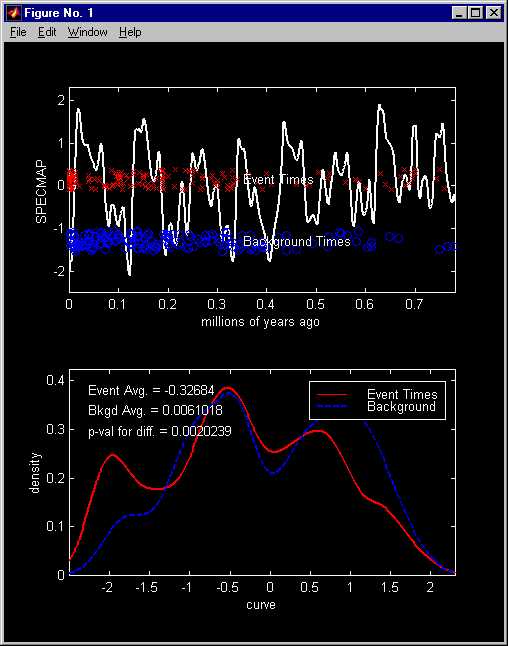
Here is another example from geology. This shows a statistically
significant (p-value ~ 0.002) connection between glaciation and volcanism.
To learn more about this example, and the CHETA method,
go .
(linked
page still under construction)
3. Non-Fourier
frequency analysis
by J. S. Marron, R. Z. Li and C. A. Giuliani
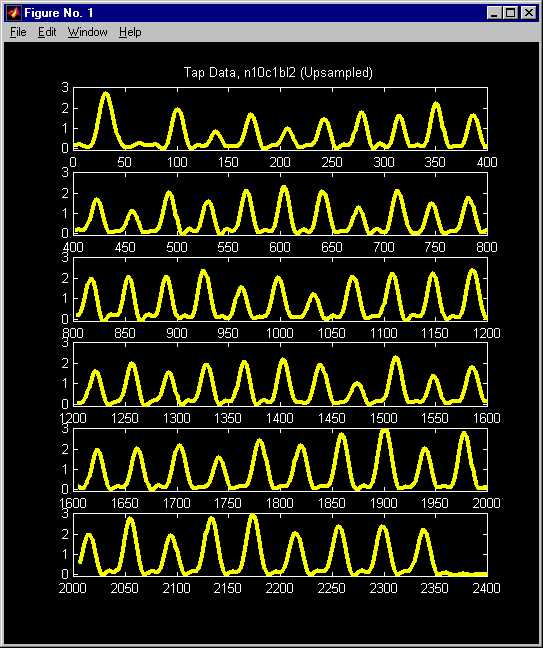
Here is one trace of a repetitive human movement. Changes in amplitude
are clearly visible. Are there changes in frequency? Which
frequency changes are statistically significant? The first question
is answered using Fourier analysis. The second question appears to
need non-Fourier methods. An approach based on "movies" is investigated.
For the full story, go here.
4.
Functional Data Analysis of Corneal Images
by N. Locantore, J. S. Marron, D. G. Simpson, N. Tripoli, J. T. Zhang
and K. Cohen
The raw data are a set of corneal curvature images, as shown here. What is the underlying population structure of this set of data?
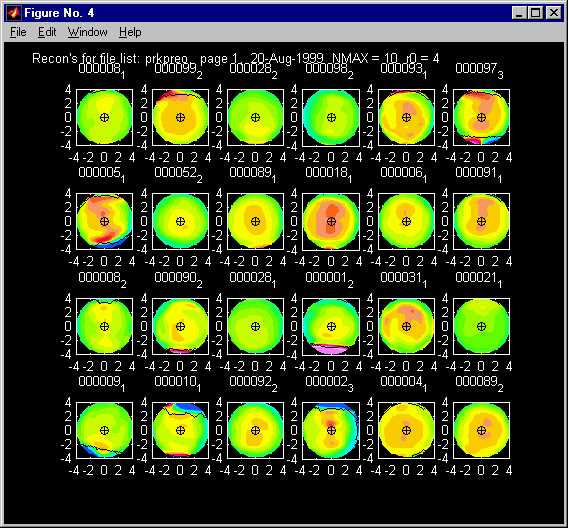
Go here
for an answer to this question (using movies in the data analysis), for
a new type of robust PCA, for the related paper to appear with discussion
in Test, etc.
5.
Significance in Scale Space
by F. Godtliebsen, J. S. Marron and P. Chaudhuri.
This addresses the same question as SiZer, see 1 above, but in the 2 dimensional case. Current versions work for 2d density estimation, and images (i.e. equally spaced regression). One problem in 2 dimensions is how to visualize the result. This is solved by using movies, where time represents the amount of smoothing (i.e. bandwidth). Another problem is that "derivative" becomes more complicated in 2d. This has motivated the development of some new visual paradigms.
Here is one frame of one of these movies
(but don't stop here!):
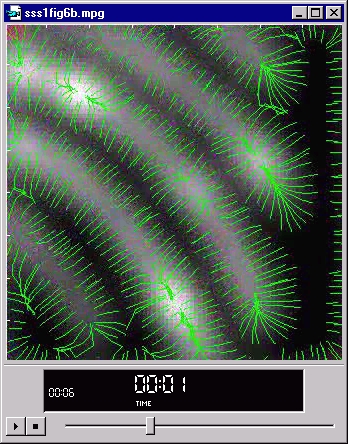
(Caution: this is only a "screen shot",
so the buttons don't work. Click here
to see this movie, but better is...)
Go here
for much more about this approach to finding structure in 2-d smoothing
contexts, including movies, papers, and downloadable software.
Go to Marron's movie page
Back to Marron's
Home Page