(This page is under contruction.)
What is SiZer all about, and how will it help me analyze data?
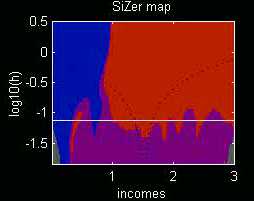
SiZer enables meaningful statistical inference, while doing exploratory data analysis using statistical smoothing methods (e.g. histograms or scatterplot smoothers). It is a new visualization that brings clear and immediate insight into a central scientific issue in exploratory data analysis:
Which features observed in a smooth of data are "really there"?
A rephrasing is:
What is "important underlying structure", as opposed to being "noise artifacts", or "attributable to sampling variability"?
This central question is critical in real data analysis, because discovery of a new feature, such as an unexpected "bump" or surprising "regions of decrease/increase", might lead to important new scientific insight (see Section B for several examples of this). The word "might" is very important, because (as shown in Section A below) while smoothing is a powerful method for finding such features, it is also capable of highlighting many spurious features. Newly discovered genuine structure leads to scientific breakthroughs, and guides research in important new directions, e.g. towards explaining the phenomenon, often with an appropriate new model. But such new research efforts require serious investment of time and resources, which are wasted should the deeper inquiry reveal that the newly discovered features were mere noise artifacts.
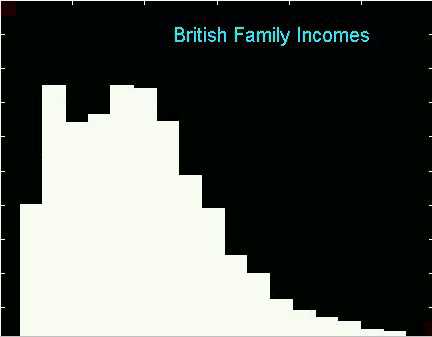
This point is illustrated by the following data set, which consist of
Family Incomes in the United Kingdom, during 1975. The histogram
suggests that there might be two modes in the income distribution.
From a classical viewpoint this would be surprising, as the several parametric
families for modelling income distributions are all unimodal. Investigation,
detailed validation (including eventual fitting of a parametric mixture
model), and explanation of the bumps became the PhD dissertation of Heinz-Peter
Schmitz (University of Bonn), part of which is published in Econometric
Theory (1992) 8, 476-488. Had the bimodal structure proven
to be a mere artifact of sampling variability, considerable effort could
have been wasted. SiZer gives even non-experts a quick and effective
means of making this important type of research decision. This point
is further illustrated in the context of this data set in Section
B.
This issue is not simple to handle, because (as illustrated in Section A) it is confounded with the problem of "amount of smoothing". Experienced data analysts (who know enough to view several levels of smoothing, and to understand what they are looking at!) are usually very effective in determining which structures are "signal" and which are "noise". SiZer allows major strides in this decision process in two different contexts:
(i) It makes this type of inference readily do-able by the non-expert.
(ii) It speeds the decision for the smoothing expert.
An index to pages with a detailed look at various aspects of SiZer, and some interesting asides follows.
??? To do: add link to software page ???
(Links to Pages with a detailed introduction to SiZer, some motivating analyses, some insightful simulated examples, connections to previous work in statistical smoothing, some interesting asides, and some ideas for extension to more complicated smoothing settings)
This section gives background material in statistical smoothing and an introduction to SiZer.
1. Histograms are "smoothers",
but here is why you shouldn't use them.
2. Kernel Density Estimation,
a "smoothed histogram", and the importance of the bandwidth.
3. An introduction to scatterplot smoothing, i.e. nonparametric
regression,
a useful way to find structure in data, and again the importance of
the bandwidth.
4. The family approach to smoothing,
look at all members of the family of smooths, i.e. all the bandwidths,
instead of attempting to choose a "best" one.
by J. S. Marron and S. S. Chung
5. SiZer,
Introduction to the basic ideas.
This section is intended for experts in statistical smoothing. It connects scale space ideas, including SiZer to earlier approaches to these problems. Here are two intentionally provocative personal opinions, that are backed up inside:
1. Bandwidth selection is no where near as important as I once thought.
2. Confidence bands are the wrong way
to undertand the variability of a smoother (i.e. curve estimator).
Here are some of the ways that the SiZer idea has been extended to date:
1. SiZer for finding jumps
by C. S. Kim and J. S. Marron
2. SiZer for dependent data
by V. Rondonotti and J. S. Marron
3. SiZer for local likelihood
by R. Z. Li and J. S. Marron
4. SiZer for censored and uncensored density and hazard rate
estimation
by J. C. Jiang and J. S. Marron
5. SiZer for length liased density and hazard estimation
by J. de Uña Alvarez and J. S. Marron
6. High Dimensional Versions
by F. Godtliebsen, J. S. Marron and P. Chaudhuri
SiZer and its higher dimensional extensions are
called "SSS", or "S cubed", for "Significance in Scale Space". Extension
to more than one dimension requires a really different visual paradigm,
although the statistical backbone is the same. So far only dimension
2 has been implemented. The statistical end is straightforward in
higher dimensions, but the visualization appears to require yet another
new set of ideas. For details in the 2-d case, go to http://www.stat.unc.edu/faculty/marron/Movies/SSS_movies.html.
Downloadable SiZer Software:
Matlab
6 Functions for SiZer and SSS (ascii)
For a Java version of SiZer (thus no Matlab required), go to Daniel
H. Wagner Associates, and follow the "Download SiZer software" link.
For more about SiZer, or if you have other questions, inquire by email from marron@stat.unc.edu.
To direct a question to the "Smoothing Alias List", or to advertise
your own recent work: smoothing@stat.unc.edu.
Back to Data Analysis Table of Contents
Back to Marron's Home Page