Details of calculation of Median, for the Binomial(12, 0.4) distribution.
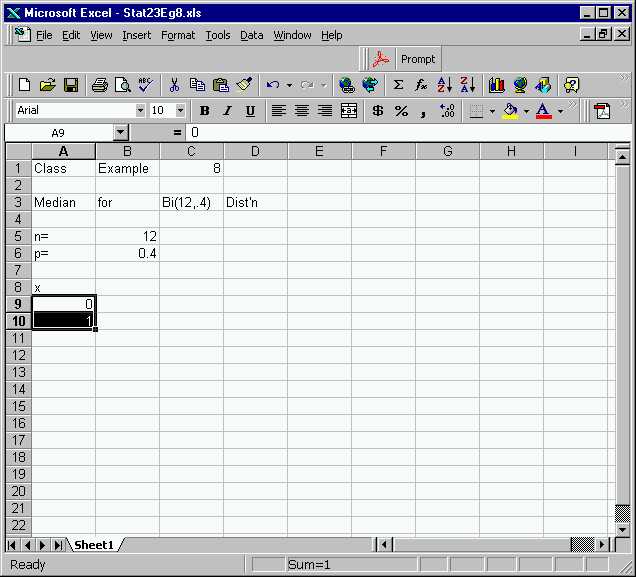
First type the needed information into a Excel spreadsheet:
Recall that to get the full range of x's, you start with the
first two desired value, grab the litle black box in the lower right corner,
and drag it downwards. In the case, the interesting values are 0,
1, 2, ..., 12.
After filling the column of x's, next create a column with P{X <=
x}. For this, first start with one of them, using very
carefully chosen absolute and relative indices (i.e. careful thought
about where to put the dollar signs in the variaous places.:
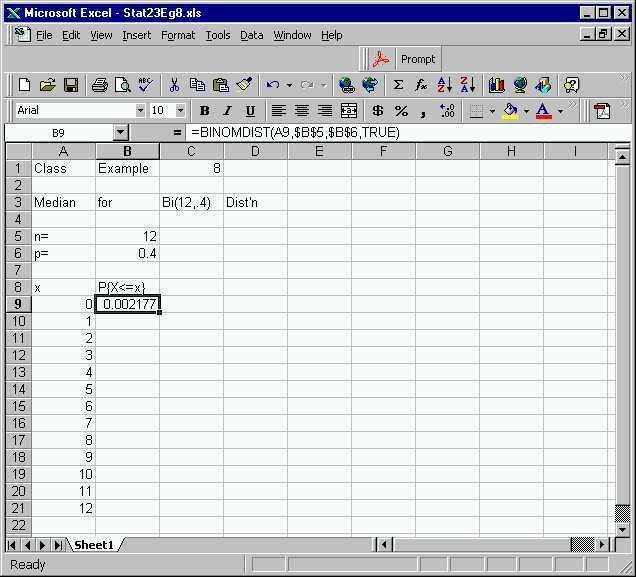
Don't go through all that menu stuff for all 12 of these (you can do
this for 12, but what if there are 100, 500, or several thousand?).
Instead, again drag that little right hand corner downwards to apply this
formula for the whole column. If you get an error for someof the
fields, you probably messed up on where the dollar signs are in the formula.
The next step is to put on the column of correponding values of P{X>=x}.
This is done as above (fill out some careful absolute and relative fields,
and then drag the little corner downwards), to give:
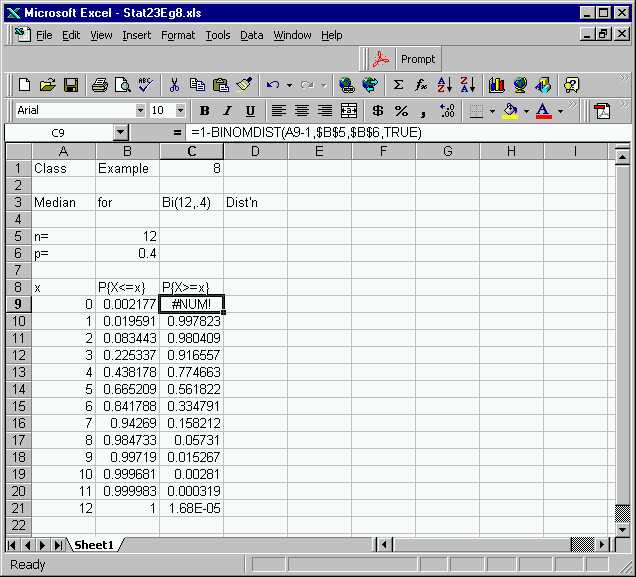
Note that the first entry is a an error. This is because can't
handle P{X >= -1}. But this is not a major problem, since we know
that it is equal to 1.
Now to find the median, note that the B column is increasing, the C
column is decreasing, and there is a point where both
of them are bigger than 0.5. That is the median. Here
is the same Excel spreadsheet, with the row containing the median highlighted.
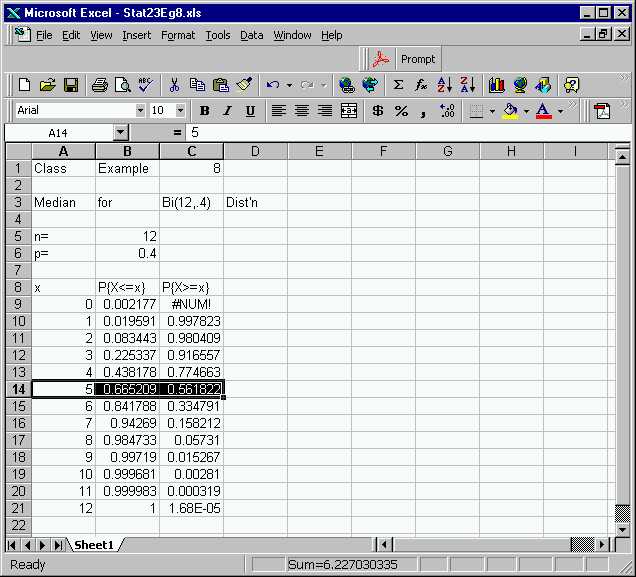
This shows that the median m = 5.
The final result of all the work done here is available on the spread
sheet version of this example.
Back to Stat 23 Home Page
Back to Marron's
Home Page